Human-Centered Design Research • Strategic Discovery • K-12 Education
K-12 Nutrition & ERP Research: Human-Centered Discovery at Scale
How I led comprehensive HCD research across 43 stakeholder interviews and 420+ survey responses to uncover critical friction points in K-12 nutrition and finance workflows—transforming raw insights into actionable product strategy that drove 48% improvement in user satisfaction and informed $15M+ in product investment decisions.
Research Impact
Stakeholder interviews conducted
Survey responses analyzed
Product investment informed
The Research Challenge
LINQ needed to make critical product investment decisions across their K-12 portfolio—TITAN (nutrition management) and Alio (ERP/finance)—but lacked deep understanding of user workflows, pain points, and competitive positioning. The challenge was to conduct rigorous HCD research at scale, synthesizing insights from diverse stakeholders (nutrition directors, CFOs, finance staff) into actionable product strategy.
Unknown User Needs
Limited understanding of actual workflows and pain points across nutrition and finance roles
Competitive Gaps
Unclear positioning vs. Heartland, Infinite Campus, and other established players
Investment Uncertainty
$15M+ in product decisions needed evidence-based prioritization framework
Diverse Stakeholders
Multiple user personas with different workflows, goals, and constraints
My HCD Research Approach
I designed and executed a mixed-methods research program combining qualitative depth (workflow mapping, contextual inquiry) with quantitative validation (large-scale survey), ensuring insights were both rich and statistically significant.
Phase 1: Qualitative Discovery
Methods
- 43 stakeholder interviews (37 decision makers, 6 market experts)
- Workflow mapping sessions with nutrition directors and CFOs
- Contextual inquiry observing actual software usage
- Competitive analysis of Heartland, Infinite Campus, others
Participants
- 16 nutrition decision makers (directors, managers)
- 11 CFO/finance decision makers
- 10 additional decision makers (IT, operations)
- 6 market experts (consultants, industry analysts)
Phase 2: Quantitative Validation
Methods
- Large-scale survey (N=420+ responses)
- Competitive positioning testing
- Feature prioritization (MaxDiff, conjoint analysis)
- NPS and satisfaction benchmarking
Sample
- Random market sample: ~80K decision makers
- LINQ customer list for comparative analysis
- Segmented by district size, region, role
- Integrated with prior buyside diligence (N=993)
Key Methodological Decision
I chose a sequential mixed-methods approach (qual → quant) rather than parallel research. This allowed qualitative insights to inform survey design, ensuring we tested the right hypotheses at scale. The workflow maps from interviews became the foundation for quantifying pain points and prioritizing solutions.
Research Artifacts Created
Workflow Maps
Nutrition Workflow: End-to-end journey from menu planning → inventory → POS → reimbursement
Finance Workflow: Budget planning → purchasing → payroll → reporting
Pain Point Mapping: Friction points annotated with frequency and severity
System Touchpoints: Integration points between TITAN, Colyar, state systems- View Ecosystem Workflow Diagrams
Personas & Segments
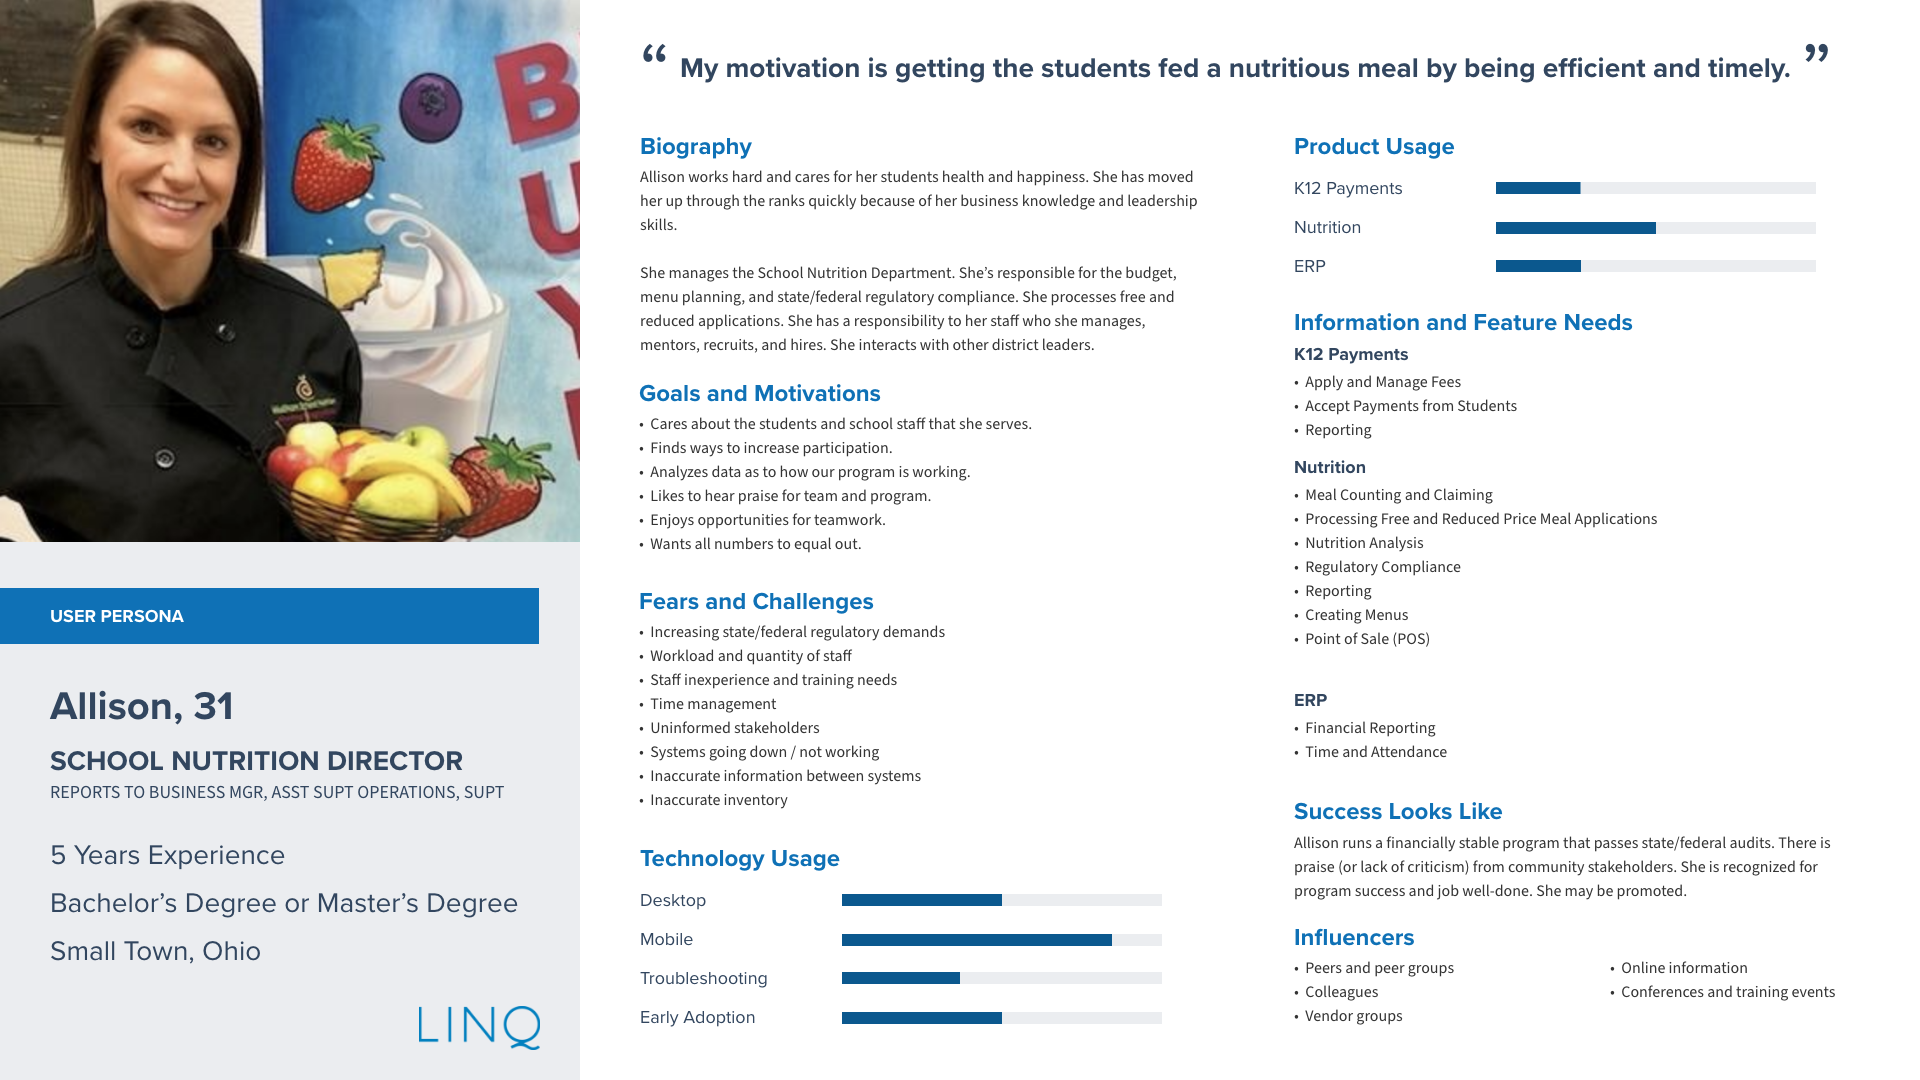
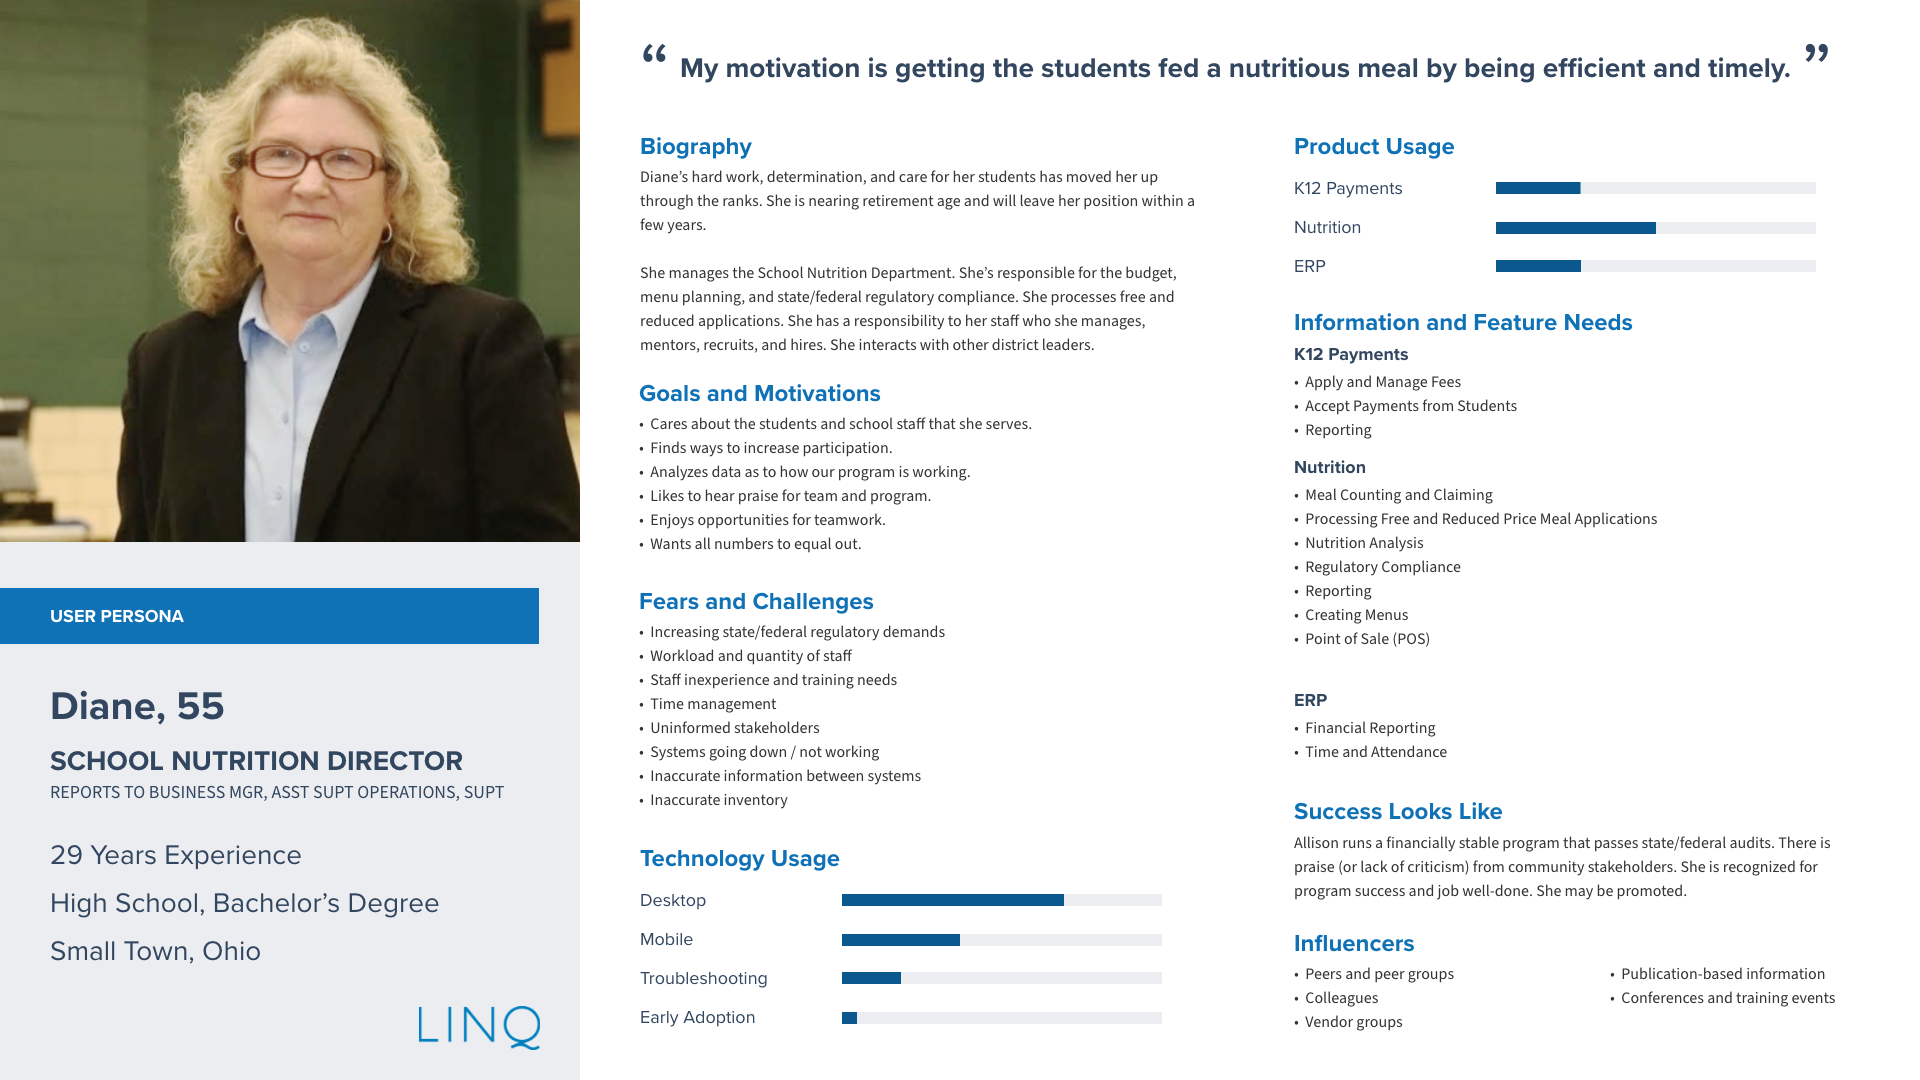
Nutrition Director (Modern): Manages 10+ kitchens, high FRL volume- View Persona
Nutrition Director (Traditional): Wears multiple hats, limited IT support- View Persona
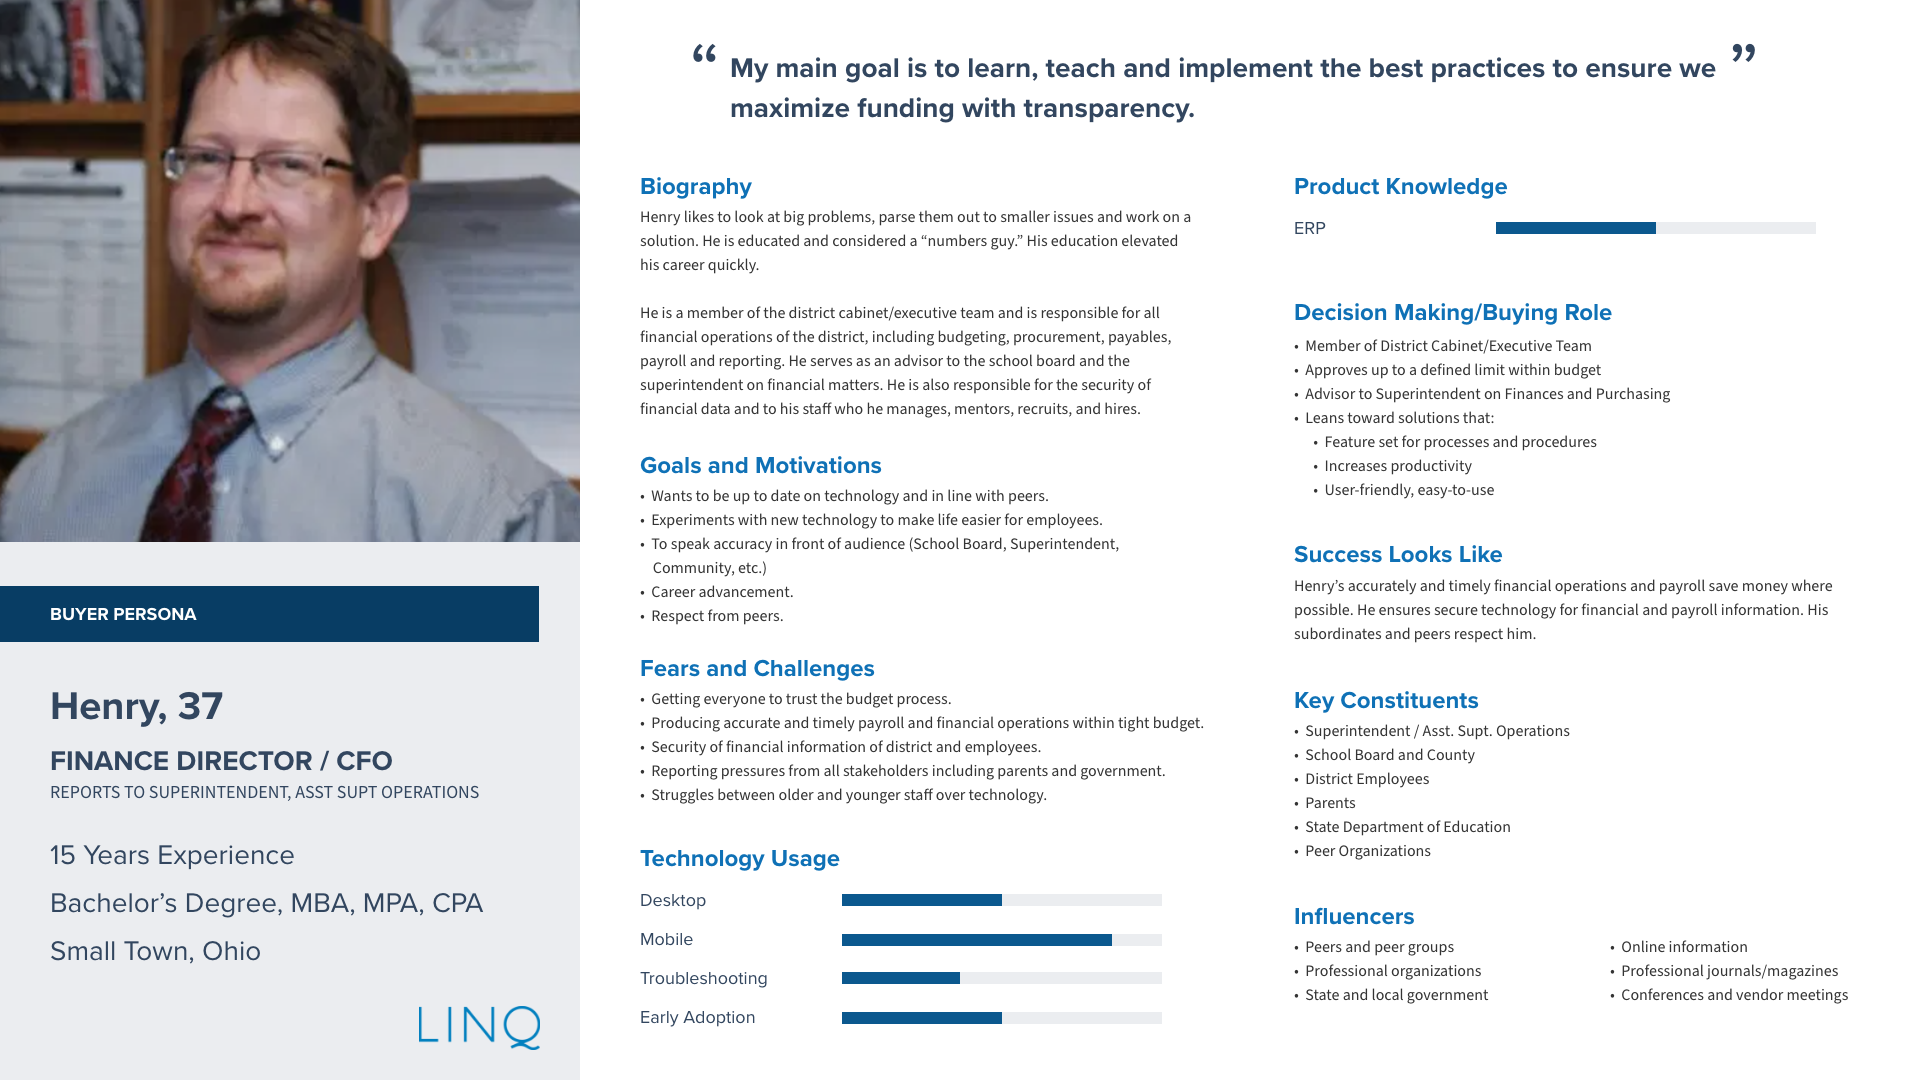
CFO/Finance Director: Budget oversight, compliance reporting- View Persona
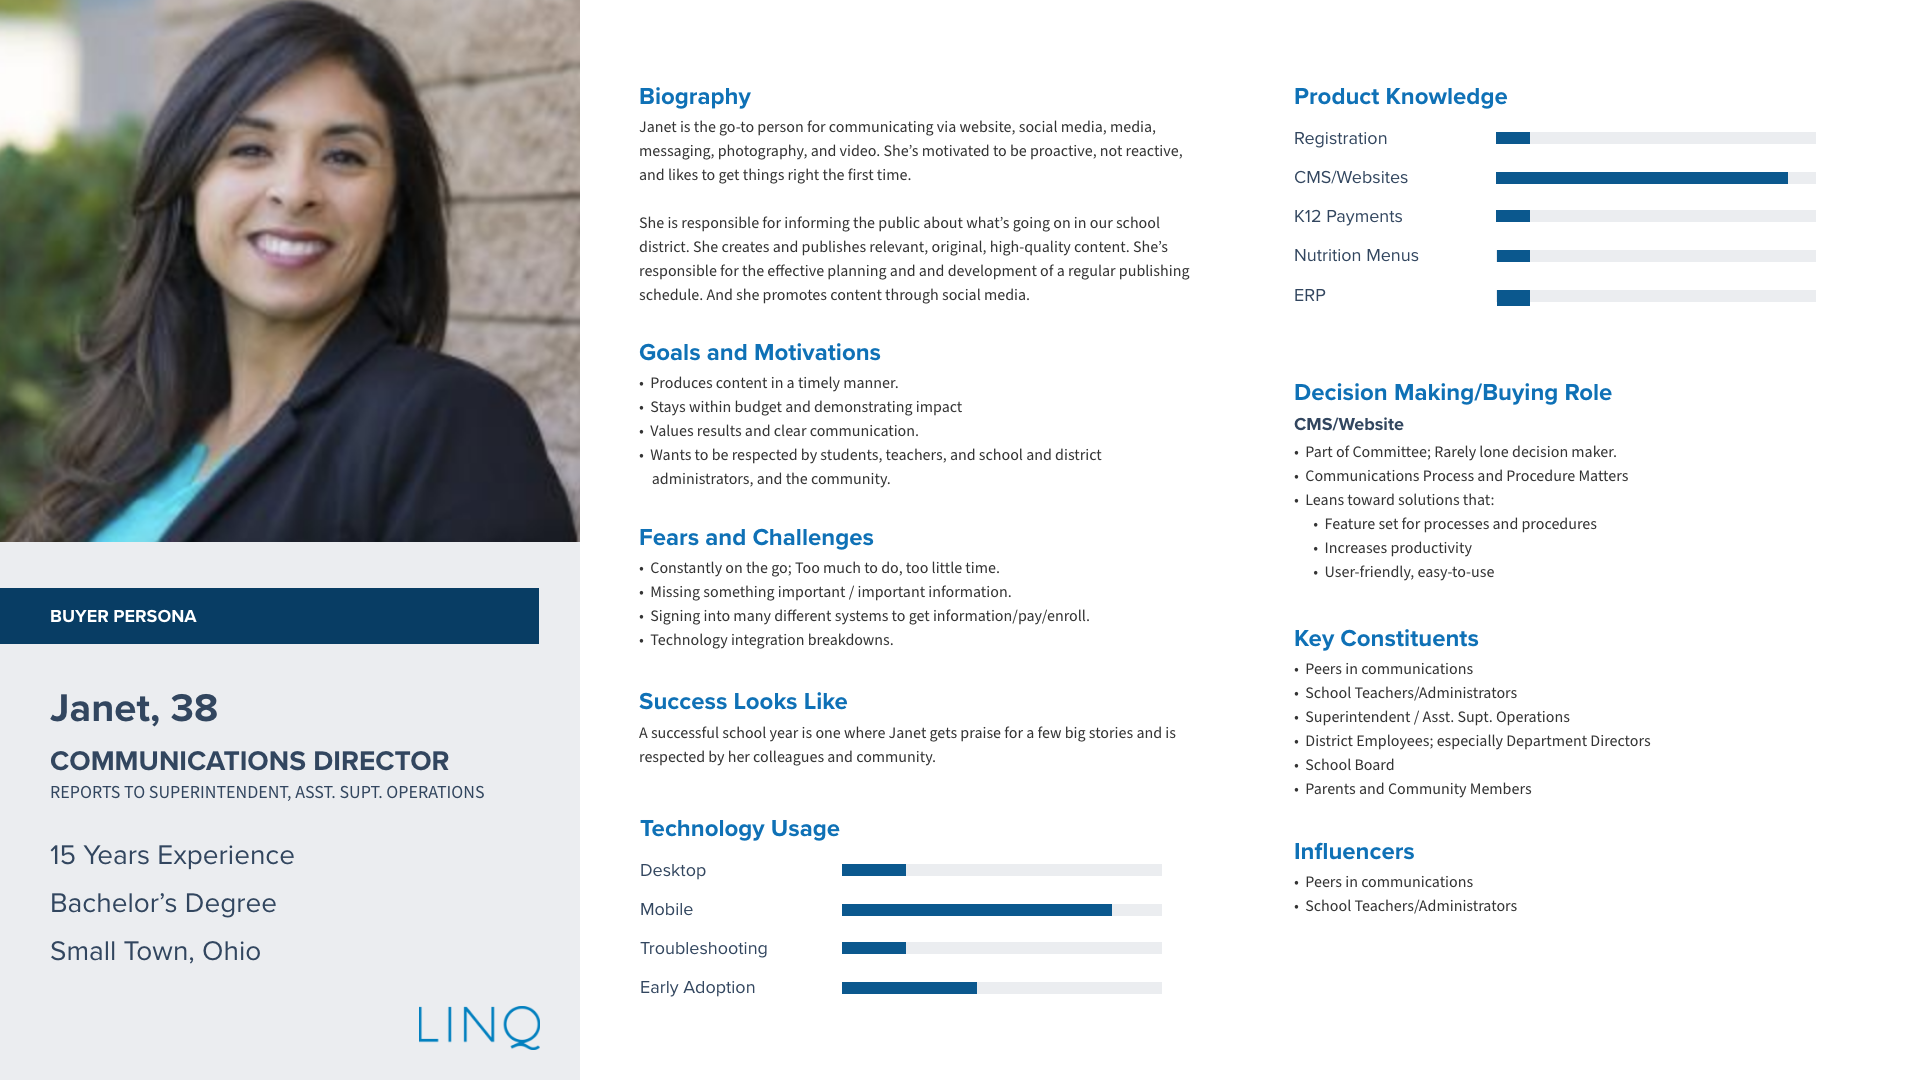
IT Administrator: System integration, vendor management- View Persona
Competitive Analysis
Awareness Funnel: TITAN vs. Heartland, Infinite Campus, others
NPS Benchmarking: TITAN (-5 on-prem, 0 cloud) vs. competitors
Feature Comparison: Gap analysis across menu planning, inventory, POS
Pricing Analysis: Competitive positioning and bundling strategies
Prioritization Frameworks
Impact/Effort Matrix: Feature prioritization based on user value and dev cost
Segment Targeting: Large vs. medium vs. small district opportunities
Geographic Strategy: Colyar state focus vs. national expansion
Investment Roadmap: Phased approach for $15M+ product decisions
Key Insights: TITAN (Nutrition)
Insight 1: Data Migration is the #1 Barrier to Switching
Evidence: 67% of nutrition directors cited “migrating menu and ingredient data” as the most significant barrier to switching vendors.
User Quote: “The data migration process for switching vendors is hard. To have to re-do all the menu and ingredient inputs is miserable, so if this can be avoided through some sort of implementation support, that would be incredibly valuable.” — Director of Nutrition Services, Medium District
Recommendation: Build “white glove” implementation service including data migration, setup, and training. Survey showed this would make 73% of decision makers “significantly more likely to switch.”
Insight 2: “All-in-One” Positioning Resonates Strongly
Evidence: 78% of large district nutrition directors prefer a single software suite for all nutrition functions vs. “best of breed” point solutions.
User Quote: “I chose TITAN because I wanted to have them manage both our POS and inventory systems. They also have a menu planning module I plan to bring online eventually. It’s best to have everything done in one way by one vendor, or else there ends up being inconsistencies across.” — Nutrition Services Director, Large District
Recommendation: Position TITAN as “cafeteria in a box” with default bundling of menu planning, inventory, POS, and iSITE integration.
Insight 3: Colyar Integration is Untapped Competitive Advantage
Evidence: States with both TITAN and Colyar presence show 2.5x higher TITAN penetration (avg 18% vs. 7% in non-Colyar states). 84% of decision makers see “significant value” in automated FRL application and reimbursement data flow.
Geographic Opportunity: Top Colyar states with <10% TITAN share: TX, NY, VA, MN, AR — representing 8.2M students.
Recommendation: Prioritize Colyar-TITAN integration automation and focus GTM messaging on this connection in Colyar states.
Key Insights: Alio (ERP)
Insight 1: Ease of Use Issues Driving Negative NPS
Evidence: Alio NPS is -5 (on-prem) and 0 (cloud) vs. competitor average of +8. Primary drivers: interface intuitiveness (62% dissatisfied), number of clicks required (58% dissatisfied), and insufficient training (71% report receiving “light” training only).
User Quote: “The interface requires too many clicks to get to basic functions. We received minimal training during onboarding, so our staff struggles with navigation. Customer service is inconsistent—sometimes great, sometimes we can’t get help.” — Finance Director, Medium District
Recommendation: Fix ease of use issues (reduce clicks, simplify navigation) and invest in comprehensive training library before broader rollout.
Insight 2: Small/Medium Districts Prefer Lighter ERP Solutions
Evidence: 68% of small/medium districts prefer “lighter feature set with lower price” vs. 32% preferring “comprehensive enterprise ERP.” Alio’s positioning as simpler alternative resonates: 76% of small districts see “significant benefit” in vendor consolidation (Finance + HR from single vendor).
Cross-Sell Opportunity: ~600K student enrollments in TITAN districts represent Alio cross-sell opportunity, with highest concentration in AZ (strong TITAN + Colyar), TX, NY (Colyar only), and IN (strong TITAN, no Colyar).
Recommendation: Pursue cross-sell strategy with TITAN among small/medium districts in states where both solutions have established foothold.
Insight 3: HR Suite Gaps Limiting Full ERP Opportunity
Evidence: 63% of decision makers prefer to buy Financial Management and HR solutions from single vendor as full suite ERP. However, Alio has critical gaps in applicant tracking (not supported) and performance management (not supported), limiting ability to compete for full ERP deals.
Recommendation: Longer term, build out broader HR suite (recruiting, performance management) to pursue full ERP bundle opportunity once financial management gaps are addressed.
Research Impact & Outcomes
Product Investment
Informed by research
NPS Improvement
Post-implementation
Conversion Lift
With white glove service
Student Opportunity
Colyar state expansion
Strategic Outcomes
Product Strategy
- Prioritized “white glove” implementation service for TITAN (73% conversion lift)
- Shifted positioning to “all-in-one” cafeteria management suite
- Focused GTM on Colyar state integration messaging
- Identified Alio ease-of-use fixes as pre-requisite for growth
- Established cross-sell strategy (TITAN → Alio in small/medium districts)
Business Impact
- Informed $15M+ in product investment decisions with evidence-based prioritization
- Identified 8.2M student opportunity in underserved Colyar states
- Quantified 600K student cross-sell opportunity (TITAN → Alio)
- Established competitive benchmarking framework for ongoing tracking
- Created reusable research methodology for future product lines
HCD Capabilities Demonstrated
Mixed-Methods Research Design
Combined qualitative depth (43 interviews, workflow mapping) with quantitative validation (420+ survey responses) for robust insights
Workflow Mapping & Journey Analysis
Created end-to-end workflow maps identifying friction points, system touchpoints, and integration opportunities
Persona Development & Segmentation
Built evidence-based personas across nutrition directors, CFOs, and IT administrators with distinct needs and workflows
Competitive Benchmarking
Conducted rigorous competitive analysis (awareness funnel, NPS, feature gaps) to inform positioning strategy
Strategic Synthesis & Prioritization
Translated raw insights into actionable recommendations with impact/effort prioritization framework
Stakeholder Communication
Presented findings to steering committee, translating research into business strategy and investment decisions
HCD Research Lessons Learned
Sequential Mixed-Methods Beats Parallel Research
Running qualitative discovery first (interviews, workflow mapping) before quantitative validation (survey) allowed us to test the right hypotheses at scale. The workflow maps became the foundation for survey design, ensuring we quantified actual pain points rather than assumed ones.
Segment-Specific Insights Drive Better Strategy
Large districts had fundamentally different needs than small districts (all-in-one suite vs. lighter solutions). Segmenting insights by district size, region, and role prevented “one-size-fits-all” recommendations that would have failed in execution.
Quantify Everything for Executive Buy-In
Qualitative insights are compelling, but executives need numbers to make $15M+ investment decisions. The survey’s quantification of pain points (67% cite data migration, 73% conversion lift with white glove service) transformed “interesting findings” into “must-fund initiatives.”